
Social scientists are victims of the quantification trap. We do things, countable things, so those things are counted, and the resulting numbers are taken to mean something; any number beats no number. Nowhere is this more apparent than in how we evaluate ourselves, and especially how university administrators evaluate us, for hiring, tenure and promotion. “Deans can’t read, but they can count,” the old joke goes: we’re not rewarded for the quality of what we write but for the sheer amount of it, and for the amount that what we write is cited.
The “Impact Factor” product sold by the for-profit Clarivate corporation (NYSE: CLVT) is the most established quantification technique, but the most-used is undoubtedly Google Scholar, both because it’s free and because it gives every academic who registers a score we can use to be compared against others. You get a total citation count, an h-index, an i-10 index – and all of those numbers restricted to the past 5 years.
Working academics I know grumble about each of these metrics. The primary problem with the Impact Factor is that different disciplines produce widely varying numbers of academic outputs per year; in Psychology, Communications and CS, 5 papers a year is on the low end, and 15-20 is not uncommon; journals and proceedings in these disciplines then naturally have higher Impact Factors than do outlets in Sociology, Political Science and Economics. So when deans compare by looking at the Impact Factors and number of publications, it looks like the psychologists are all superstars and the sociologists slouches.
The issue with Google Scholar citation counts is more personal. The unit of aggregation is the individual, and the total citations are summed across all of her papers, but there’s no real accounting for the number of co-authors on those papers. As research has gotten larger and more complex, like in computational social science, the number of co-authors has (justifiably) ballooned, especially for the highest-profile, most-cited papers. Members of large lab-style teams thus have “inflated” Google Scholar counts relative to their actual personal influence.
So, grumpy colleagues, if you don’t like those metrics, I’ve got good news: Research.com just rolled up and slammed their D-index on the table.

Research.com sounds like it would’ve been a very valuable internet domain in 1994, when that sort of thing mattered. In 2026 it’s a bit on the nose, though downright subtle compared to the name of their metric. The veil has dropped; the putatively pure pursuit of knowledge is revealed to be nothing more than a D-index measuring contest.
But the good folks at Research.com (btw, if a website introduces itself as “a leading academic platform for researchers,” it isn’t), in promoting their own, distinctive for-profit metric, may have inadvertently gone a step too far. The proliferation of boutique metrics is dangerous for the legitimacy of metrics in general.
When metrics are expensive to produce, proprietary, and thus scarce (the Clarivate (NYSE: CLVT) Impact Factor), they are easily legitimated, the only game in town. On the other end of the spectrum, when metrics are free to consume and thus ubiquitous (Google Scholar, the cost a rounding error for Alphabet and the data now somehow surely feeding Gemini and other AI products), they are easily naturalized, taken for granted as a good enough measure that people cease to even think about the gap between the measure and the complex reality.
The D-index reveals that there are different metrics that can be used to represent that reality – thereby de-naturalizing any one of those metrics and revealing that metrics are no longer scarce. Now we are forced to think about what goes into those metrics to decide which is best at capturing what we really care about. Research.com’s intervention in this space argues that the problem with Google Scholar’s h-index is that it’s too lowercase and too interdisciplinary; the big D-index is a discipline-specific h-index.
If I were to rank my problems with the h-index, that wouldn’t be in the top 100; it’s completely insane to look at social science and say “this is fine except that there’s too much interdisciplinarity, we need to punish collaborations across fields.” But instead of whining, I’ve decided to take Research.com’s example and be the metric I want to see in the world. What should go into the k-index?
I believe that social science needs to reward diversity in the forms of scientific production. One weak point of any metric is the extent to which it’s min-maxxable: that is, whether scoring high on the metric can best be achieved by pursuing a degenerate strategy of doing just one thing over and over. For example, when Starcraft 2 came out, I cheesed my way to diamond with Zerg doing 6 pool + baneling bust.1 For a slightly less but still very nerdy example, I figured out in high school that the SAT essay was graded mostly on length, so you could max your score by writing as much as possible, including padding with big words and invented statistics, without writing anything with actual meaning. AI is surely achieving superhuman scores on the SAT essay section!
To avoid this gamesmanship, the k-index is a carefully calibrated combination of different factors. The diversity is key: I decided to cap the contribution of each individual feature to the composite metric at .25. I thought about this a lot, and purely theoretically, I arrived at the following features at the most important:
Solo citations: a true measure of individual contribution and influence. You need to have at least some solo-authored work, and it should be rewarded if that work is especially influential.
Methods citations: methodology, as I frequently write, is upstream of the substantive work that social scientists conduct. If you’ve made a methodological contribution that others cite, that’s an indirect contribution to a wider range of research outputs.
Recent activity: we don’t need another way to honor Plato, Weber or Putnam; this measure is specifically about recent output, so I want to upweight people who have published most of their work recently.
And then, again using theory, I determined that somewhat less weight is assigned to other measures:
Fractional citations: large-scale collaborations are still extremely valuable, but this applies the appropriate 1/N penalty, where N is the total number of authors.
Recency-weighted citations: a more continuous measure of the temporal validity of a contribution: citations to recent work get more credit than citations to older work.
Two more minor contributions:
Solo share: the fraction of an author’s work that is sole-authored, just another way to operationalize the first feature.
Outside reach: the interdisciplinarity of work, here, the percentage of work with a secondary classification outside of the core social sciences.
A few caveats about the data. Thanks to Claudio, my extremely hardworking and fastidious Italian research assistant, I was able to quickly code up a scraper to grab the necessary bibliographic metadata from OpenAlex. But the data is restricted to political science so far, given data constraints and my area of expertise, and only goes back to 2000. The data aren’t super clean yet; many people have multiple profiles on OpenAlex, and I haven’t verified the coverage across journals. There might some journals I’m missing, and some that probably shouldn’t be included.
But I want to emphasize the value of OpenAlex. This is a fantastic, open source, not-for-profit database that should be the backbone of any serious metascientific project. Their API is free for all but the heaviest-duty calls, and if you’ve got the hard drive space (1.2TB) you can just directly download a snapshot of the entire database; serious metascientific work needs to be replicable and therefore cannot rely on proprietary databases.
I realize that I’m laying the anti-corporations-in-scientific-publishing on a bit thick at this point, but actually, I should be laying it on even thicker. This is the one scientific reform that we can all agree on: “it is time, finally and forever, to get rid of for-profit scientific publishers.” This isn’t just an ideological point, though my anarchist sympathies are genuine. This is a fundamental methodological point. The interests of science and the interests of publishing corporations will continue to diverge in the age of AI, as I discuss in For-Profit Academic Publishers Love LLM Garbage.
I co-founded and now co-edit an academic journal, the Journal of Quantitative Description: Digital Media. OpenAlex provides an overview, along with their native metric, the 2yr mean citedness score. (It turns out that the Clarivate (NYSE: CLVT) Impact Factor isn’t that hard to dupe, since it’s literally just an additional problem followed by a division problem.)
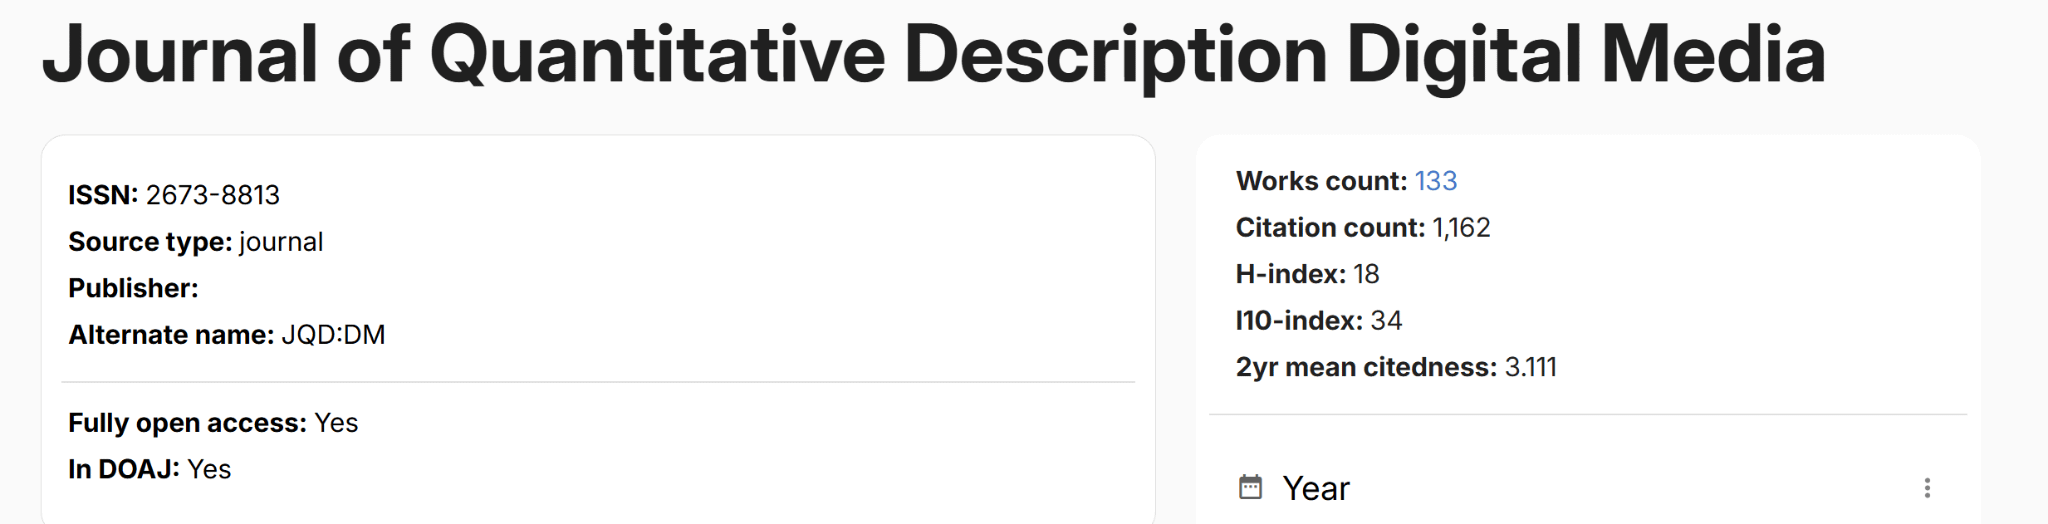
That’s fully diamond open access, so we don’t pay anybody or charge anybody anything; we just put the pdf on the internet. Contrast this with an outlet like the august Electoral Studies, published by the good people at Elsevier (parent company NYSE: RELX).
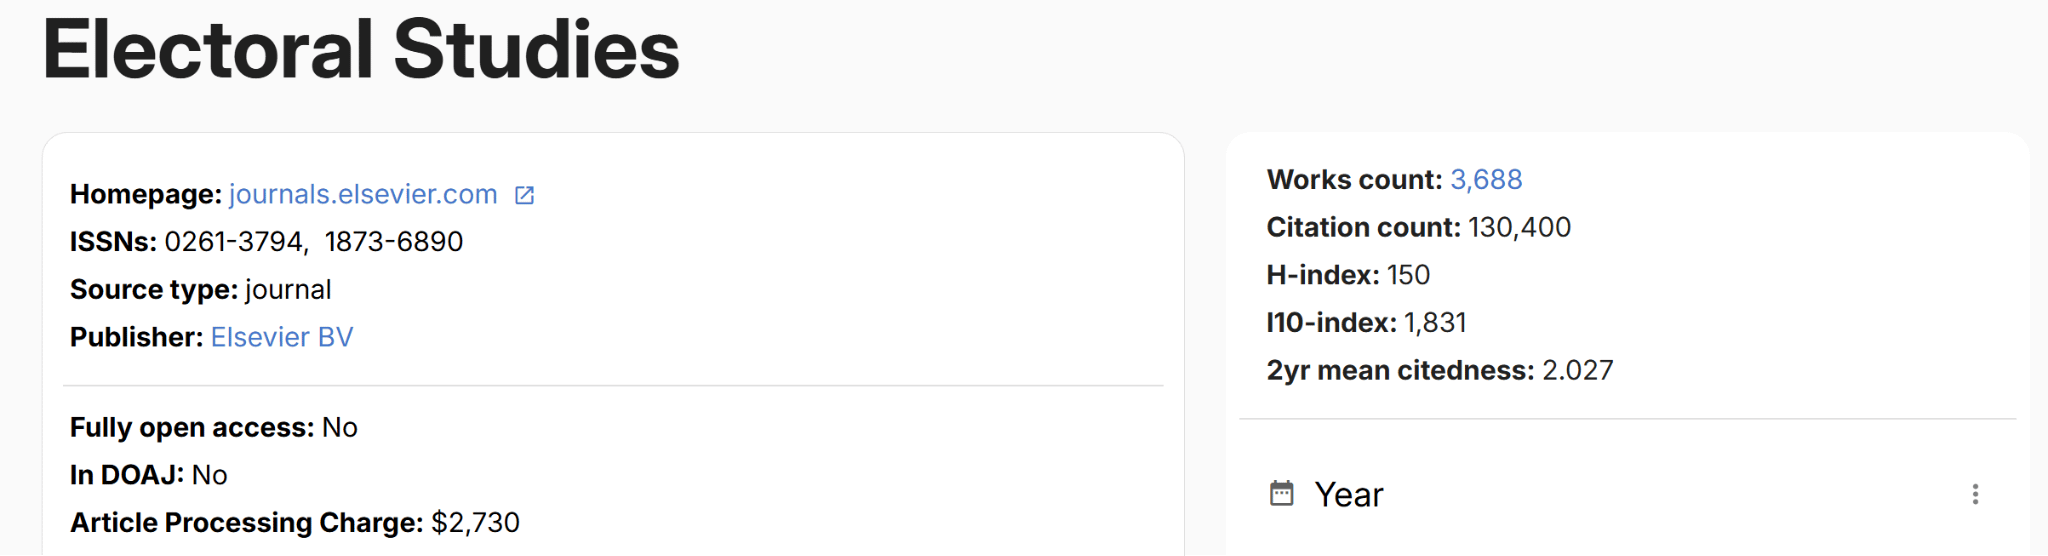
I was dumbfounded to see an Article Processing Charge of $2,730 for a journal like Electoral Studies, with a 2year citedness score only 65% of ours. Nature Human Behavior has an APC of $12,850, but at least it’s Nature Human Behavior. I went to the Electoral Studies website to confirm, and here we see that there are some limitations of the open source model like OpenAlex uses; the data is in fact out of date.
Electoral Studies has raised their APC to $3,020.
Taking that figure and multiplying across the 133 articles that the JQD:DM has published for free, we can see that my co-editors and I have prevented $400,000 from leaking out of the academic ecosystem. This ecosystem, especially in the US, is facing brutal funding cuts; we cannot afford to continue to pay corporate welfare as well.
OpenAlex hasn’t yet calculated an “open access” score that can be synthesized with the citation data, but a future version of the k-index should cross-walk between authorship and editorship to take this kind of contribution into account. The work of editing journals has long been understood to be an act of service – one that only fully established academics can afford to undertake, because of the opportunity cost to increase your score on a more visible metric. This is the beauty of the metascience of bespoke metrics: we can decide what actions to make visible through quantification.
And decide, I have. Finally, I present the k-index. I’ve got over 36,000 scholars (most of whom are political scientists) with at least 5 eligible publications and 100 eligible citations. Feel free to search yourself; again, I can’t promise anything on the coverage, the data are still being refined, and let me know if you can’t find yourself. Here’s a screenshot of the final formula (which I determined theoretically) and the top 10 political scientists.
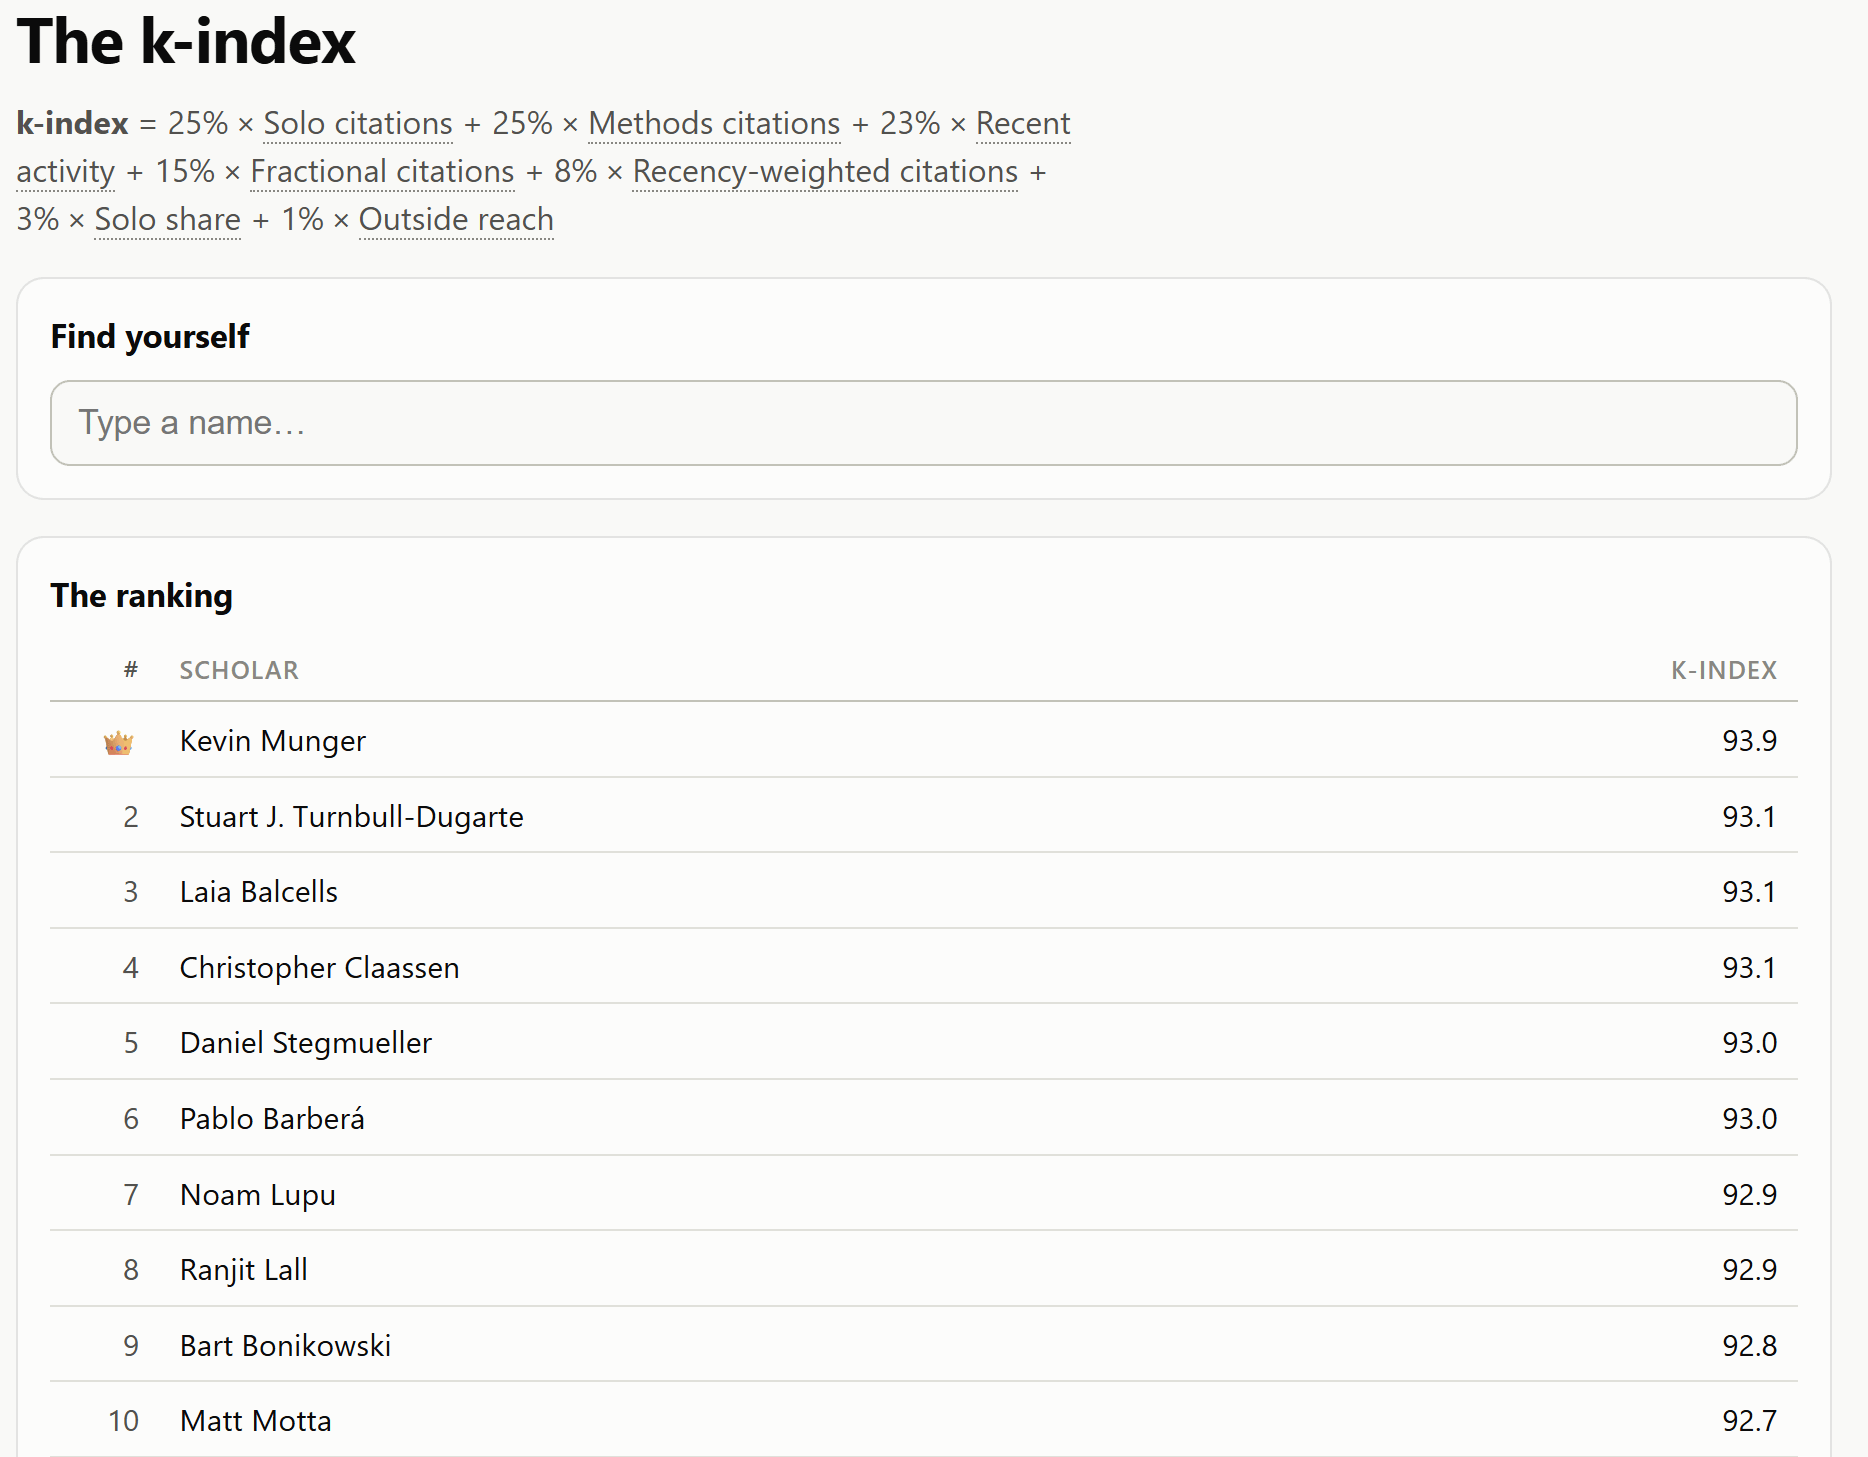
Wow. I don’t know what to say. I’m seeing these results now for the first time. As I suspected, a less arbitrary, more theoretically-driven metric recognizes the unique value of my contribution. Maybe quantitification isn’t so bad after all.
iykyk
And thus 2 more competing standards emerge https://xkcd.com/927/